ICSC InfoMonitor monitoring system: All-round AIoT platform intelligent guardian
In the AIoT era where everything is connected, enterprises face challenges such as a wide variety of equipment, data dispersion, and monitoring lag. ICSC InfoMonitor monitoring system is designed to solve the operation and maintenance problems of large AIoT platforms. Through intelligent monitoring, real-time early warning and visual analysis, it helps enterprises realize full-stack resource management from hardware to software, from local to cloud.
1. Directly hit the pain points of the industry and reshape the monitoring experience
Traditional AIoT platforms often fall into three major difficulties:
Resource Fuzzification: Hardware utilization and service load lack transparent data support, and decision-making depends on empirical guesses;
Monitoring fragmentation: independent monitoring of each system (VM, database, container, etc.), low manual inspection efficiency;
Response lag: passive processing after a fault occurs, lacking real-time early warning and active alarm before resource exhaustion.
InfoMonitor's solution:
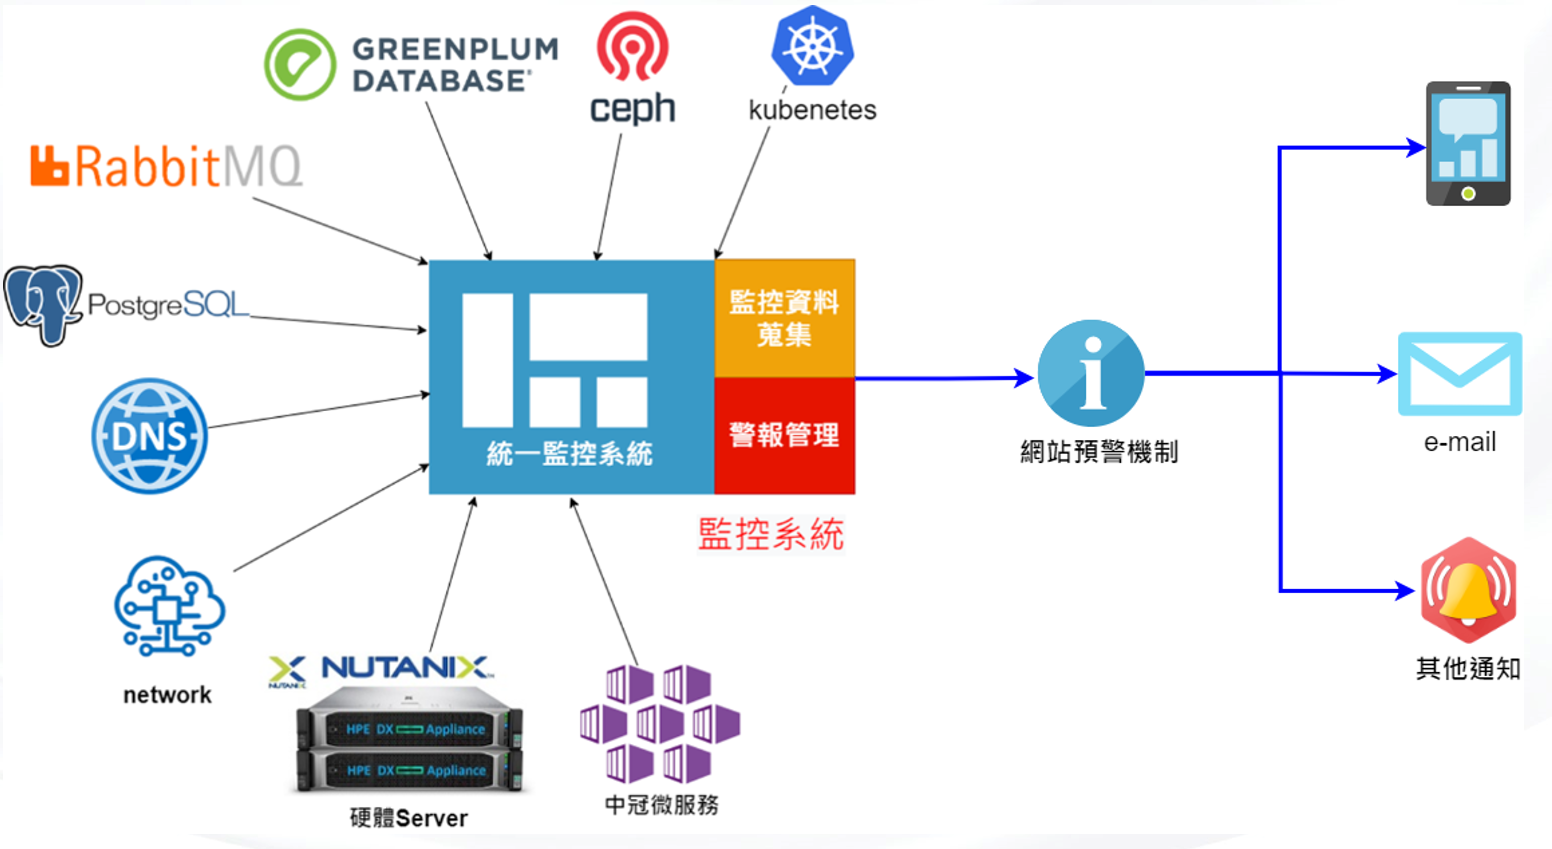
Unified monitoring center: integrate software and hardware resource data, break system barriers, and realize "one-screen unified viewing";
Intelligent closed-loop management: Through the closed-loop of "real-time acquisition-AI analysis-precision early warning-automatic disposal", the problem is strangled in the bud;
Predictive operation and maintenance: Based on historical data and machine learning algorithms, early warning of potential risks (such as disk overflow and GPU overload) to reduce business interruption losses.

2. Four core functions to build an intelligent monitoring system
1. Collect all-area data, flexible adaptation to multiple scenarios
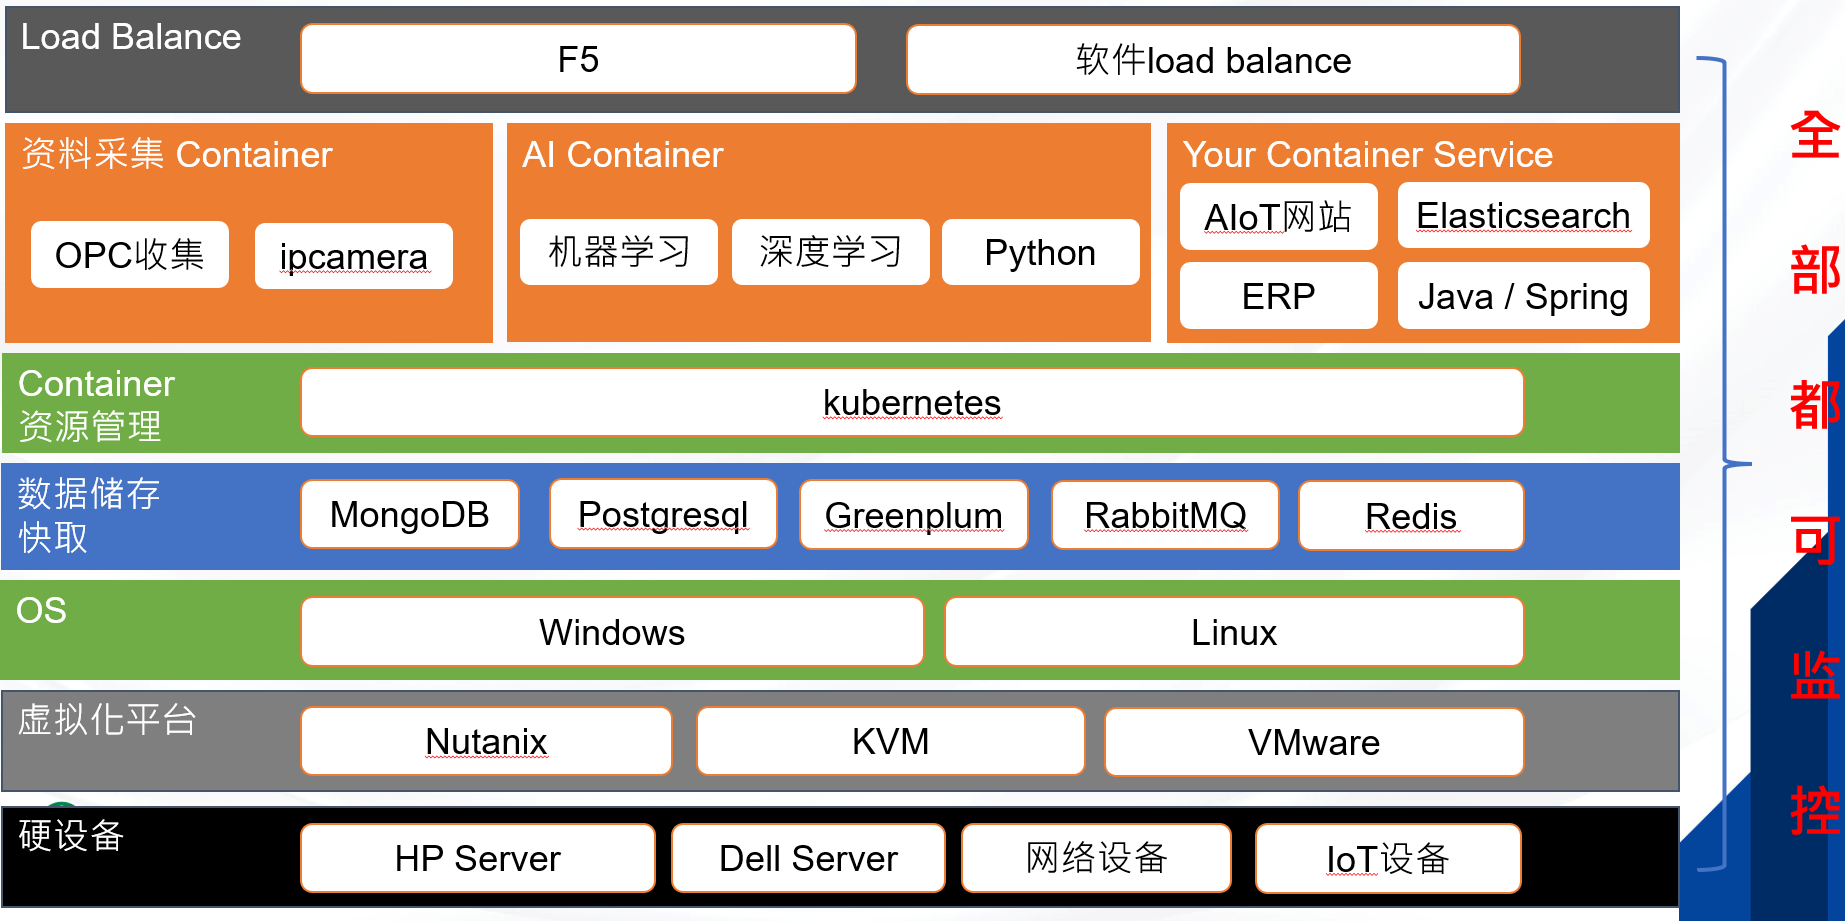
Full coverage monitoring: supports physical hosts, VMware/KVM/Nutanix virtualization platform, Docker/K8s containers, GPUs, network devices and IoT terminals, and is compatible with Java/Python/ERP and other applications;
Multi-protocol compatible: supports HTTP, TCP, UDP, SNMP and other protocols, and can be extended to Internet of Things protocols such as MQTT and CoAP;
Custom acquisition frequency: Set the data acquisition cycle (second to hourly level) as needed to balance monitoring accuracy and system load;
Black box monitoring mode: Monitor the functional status of third-party systems (such as non-China Crown software) through HTTP/TCP and other protocols without intrusion into the program.
2. Monitoring visualization: a clear decision panel
Dynamic data board: displays core indicators such as CPU/memory/disk/network resource utilization, queue length, and transmission volume in real time;
Historical tracking and customized view: supports timeline back-tracking analysis and provides customized monitoring boards (such as divided by department and business line);
Visual large screen: digital twin models can be optionally equipped to intuitively present the equipment distribution and operating status, suitable for command center scenarios.
3. Real-time alarm and predictive protection
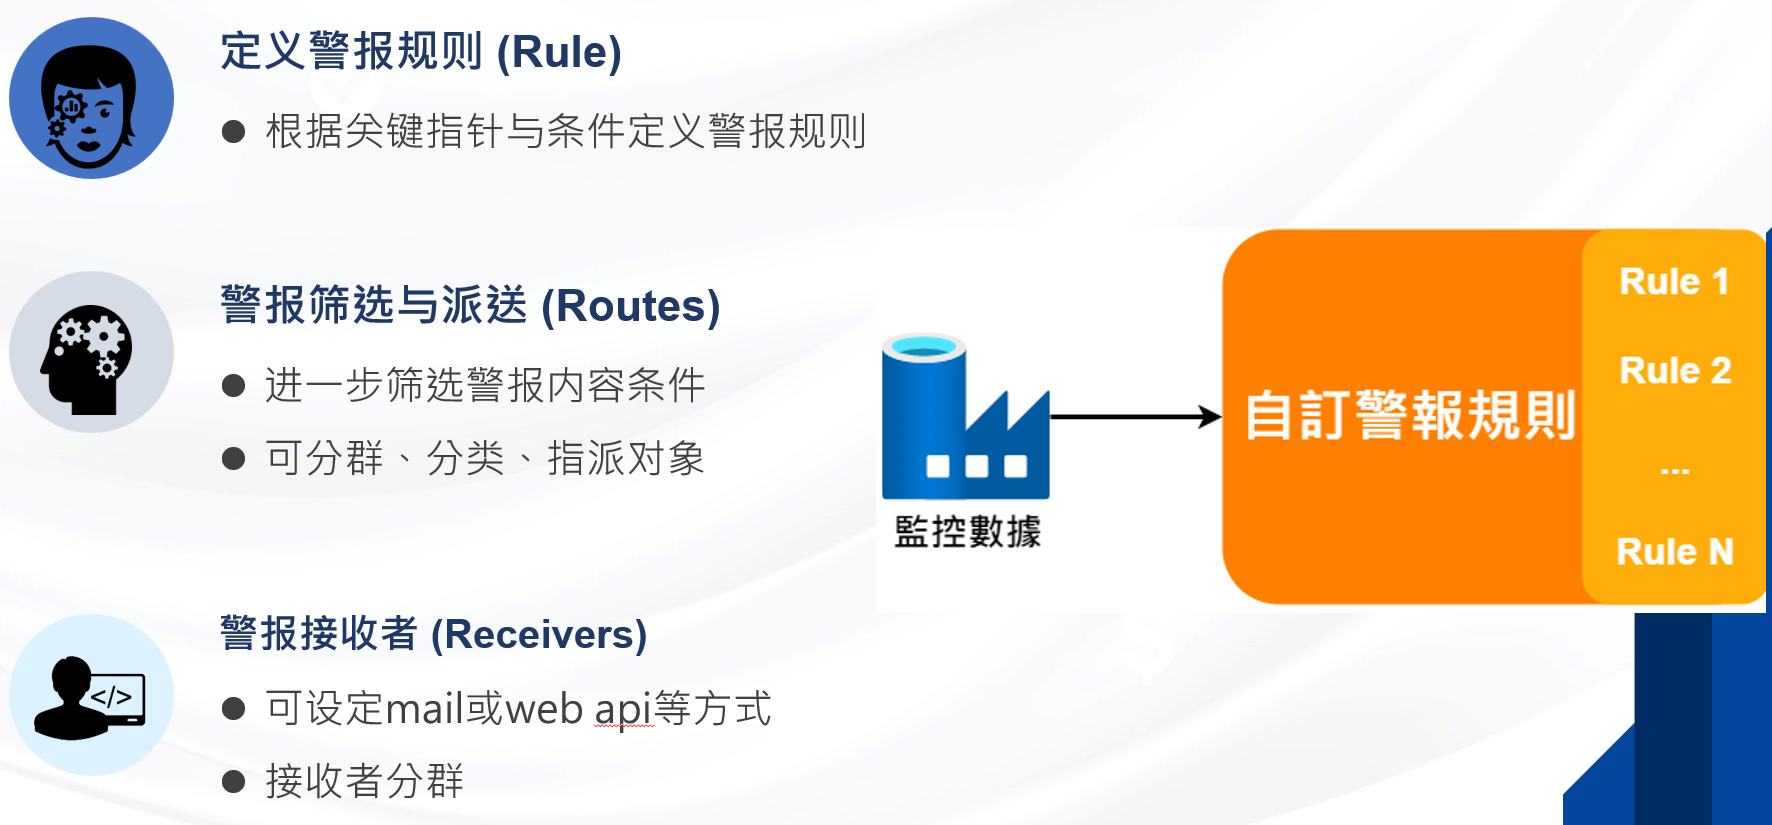
Intelligent rules engine: Users can define thresholds (such as less than 80% of disk space) to trigger alarms, and support group delivery to emails, weChat or enterprise communication tools (such as DingTalk and Feishu);
Predictive alarm: analyze historical trends based on AI models and warning for potential risks in advance (such as disk overflow and service response delay);
Multi-channel notification: Support mobile APP, email, API push and other methods to ensure that operation and maintenance personnel respond as soon as possible;
Automated handling: supports linkage with tools such as Ansible and Terraform to achieve self-healing of faults (such as automatic capacity expansion and restarting services).
4. Seamless access and lightweight deployment
Zero threshold integration: can be installed in VM, physical machine or K8s cluster, with a minimum configuration of only 2 cores of CPU + 2GB of memory;
Data storage optimization: By default, data is saved for 1 month, and the storage cycle is adjusted as needed. The capacity of 20GB to 60GB can cover monitoring of hundreds of devices;
Open extensibility: Provides SDK and API interfaces, supports users to independently develop Exporter (data collector) and alarm rules, and flexibly adapt to emerging technology stacks .

3. Empower practical scenarios and witness the implementation of value
1. Accurate control of AI computing power
Monitor GPU usage, memory usage, temperature and other indicators in real time to provide data support for AI training resource planning;
2. Microservices and container escort
Deeply integrate Kubernetes, tracking container resource consumption (CPU/memory/network), service health status (such as the number of Pod restarts);
Supports DevOps process, links with tools such as Jenkins, GitLab, etc. to realize CI/CD pipeline monitoring.
3. Business Continuity Guarantee
Monitor key services (such as ordering systems, mail servers) through HTTP/TCP, and respond instantly to exceptions;
Supports heartbeat detection and failover to ensure high availability architectures (such as switching between main and backup computer rooms).
4. Hyper-converged architecture optimization
Centrally manage Nutanix/VMware host resources and dynamically adjust VM allocation policies;
Combined with load balancing algorithms, improve resource utilization in virtualized environments.
5. Smart cities and industrial Internet of Things
Monitors IoT devices such as street lights, cameras, sensors, etc., and supports the management of edge computing nodes;
Adapt industrial protocols (such as OPC UA) to realize remote operation and maintenance of PLCs, robots and other equipment.
4. Technology highlights and differentiated advantages
Heterogeneous compatibility: spans Windows/Linux, physical machines/virtual machines, local/cloud environments, breaking down vendor barriers;
Predictive operation and maintenance: shift from "fault repair" to "risk prevention" to reduce business interruption losses;
Lightweight and efficient: minimalist installation process, avoiding complex configurations and high resource consumption, suitable for small and medium-sized enterprises to quickly implement;
Security compliance: Supports national encryption and audit logs, meets the requirements of equal-guarantee 2.0, and meets the needs of sensitive scenarios such as finance and government affairs.

5. Adaptation scenarios and deployment solutions
Applicable objects:
Intelligent manufacturing: monitoring of factory equipment, production line MES system, management ERP system;
Data center: unified management of servers, storage and network equipment;
AI R&D: GPU cluster, deep learning training task monitoring;
Smart city: remote operation and maintenance of IoT terminals and edge computing nodes.
Deployment Mode:
Standalone version: suitable for small and medium-sized enterprises, can be installed on VMs or physical machines;
Cluster version: supports K8s integration, suitable for large-scale distributed environments;
Hybrid cloud solution: compatible with private cloud and public cloud (such as Alibaba Cloud and Huawei Cloud), achieving cross-cloud monitoring.
6. Customer witness and value quantification
A ferrous metal smelting and calendering manufacturer: Through InfoMonitor, a unified monitoring of 10,000 equipment was achieved, and the fault response time was shortened by 70%, and the operation and maintenance cost was reduced by 45%.
Summary : InfoMonitor takes "full-domain monitoring, intelligent early warning, lightweight and flexible" as the core, helping enterprises bid farewell to blind operation and blindness, and maximize resource utilization and minimize operation and maintenance costs. Whether it is ICSC’s own solutions (ERP/MES) or third-party systems, they can be included in the unified management platform through their powerful compatibility and scalability. Deploy InfoMonitor immediately and control every pulse of the AIoT ecosystem!


 2025-06-18
 ICSC News
 上一篇
上一篇


